Requires pro
Analytics is a pro feature. You need to upgrade to pro version to unlock this feature. If you have already upgraded to pro version, ignore this message.
Quick view analytics (Beta)
Quick view analytics feature allows you to track the user interaction with the quick view modal. You can track the number of times the product was viewed. This feature helps you to understand the user behavior and make data-driven decisions.
Total views count (pro)
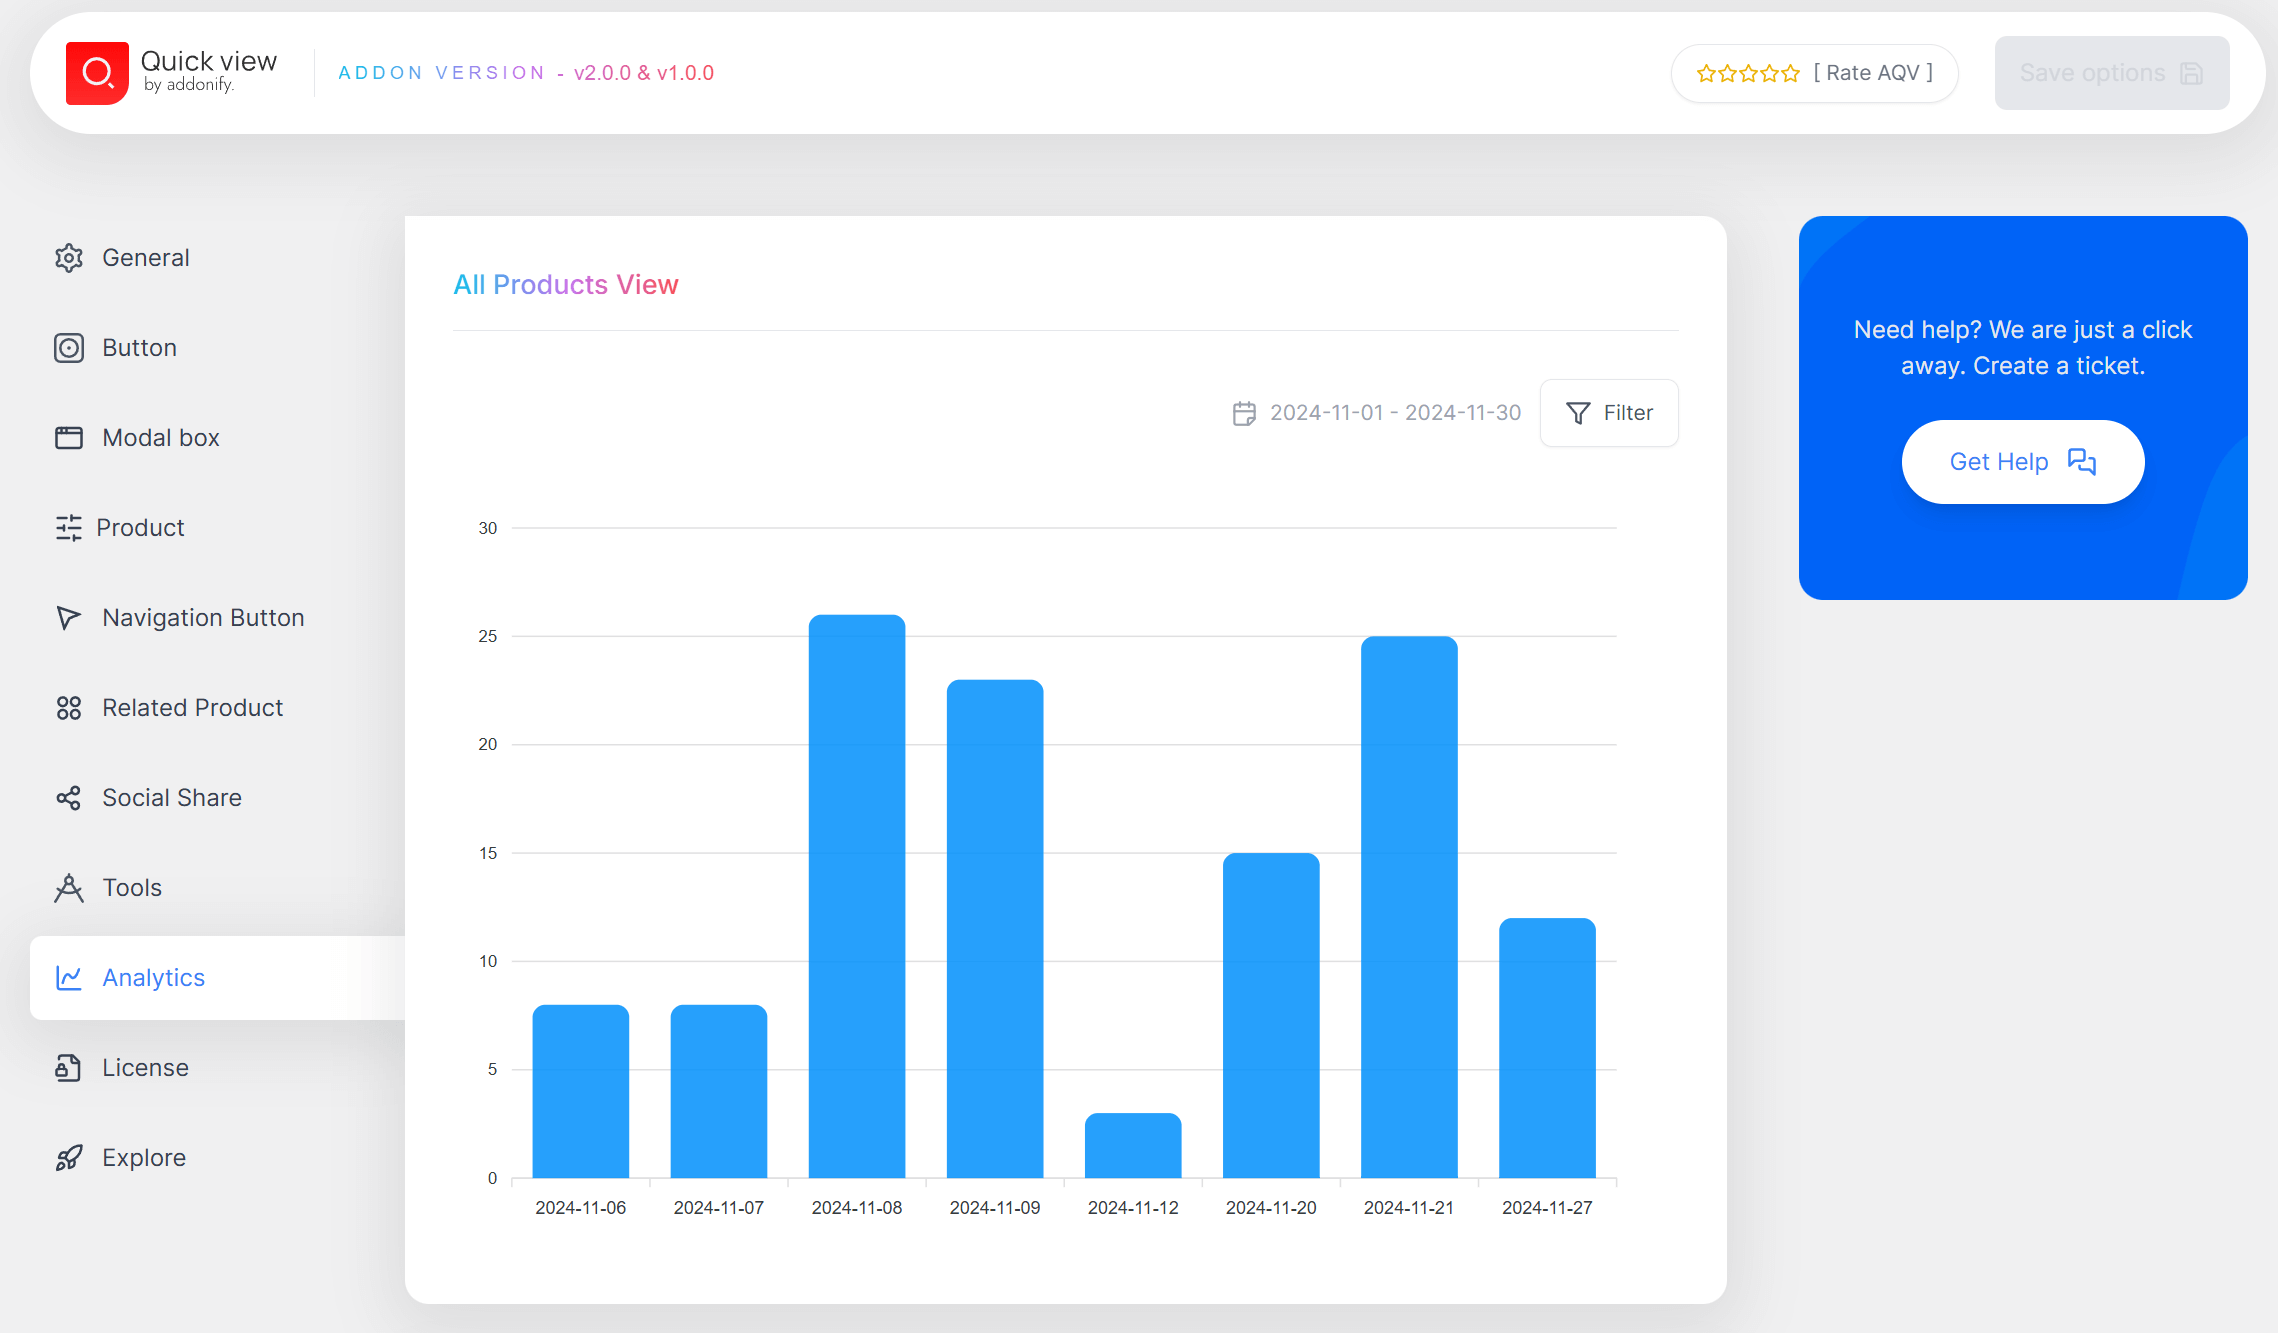
Total views count shows the total number of times all the product of your Woocommerce store was viewed in a single day, either through the quick view feature or on the product page. You can view chart of different time intervals using the date filter we provided. Default time interval is 15 days, ie. you can view the chart for the last 15 days.
These metrics helps you to understand if the users are interacting with the product. You can use this data to improve the product visibility and user experience. Total views is represented in a graph format for better understanding. The bar graph shows the total views count for each day in the selected date range.
Date filter (pro)
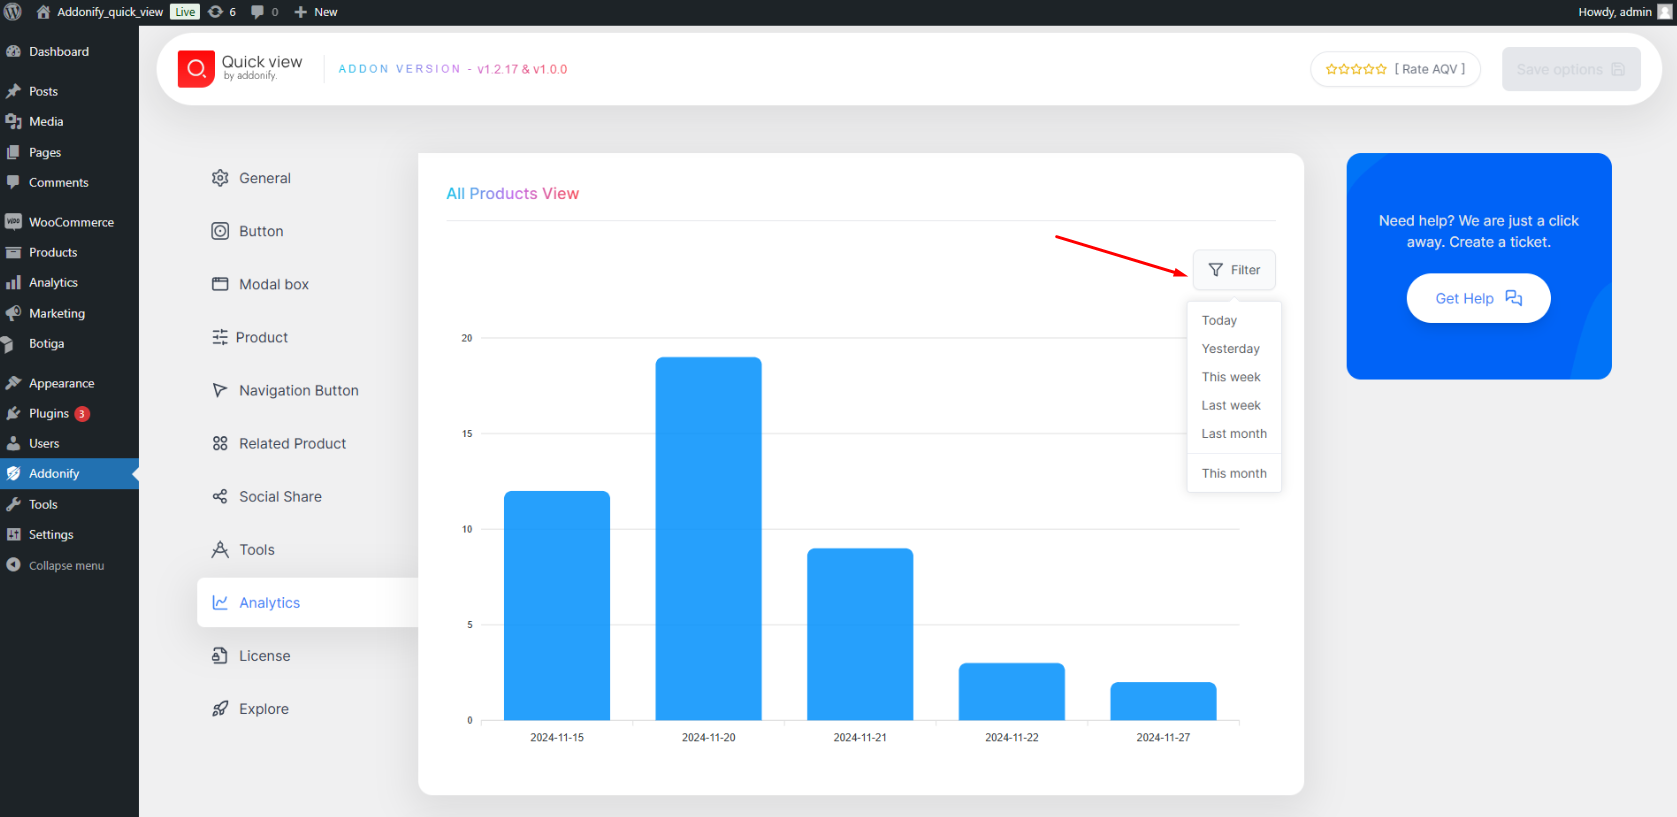
You can view the chart for different time intervals using the date filter we provided by clicking the filter button.
Products views count (pro)
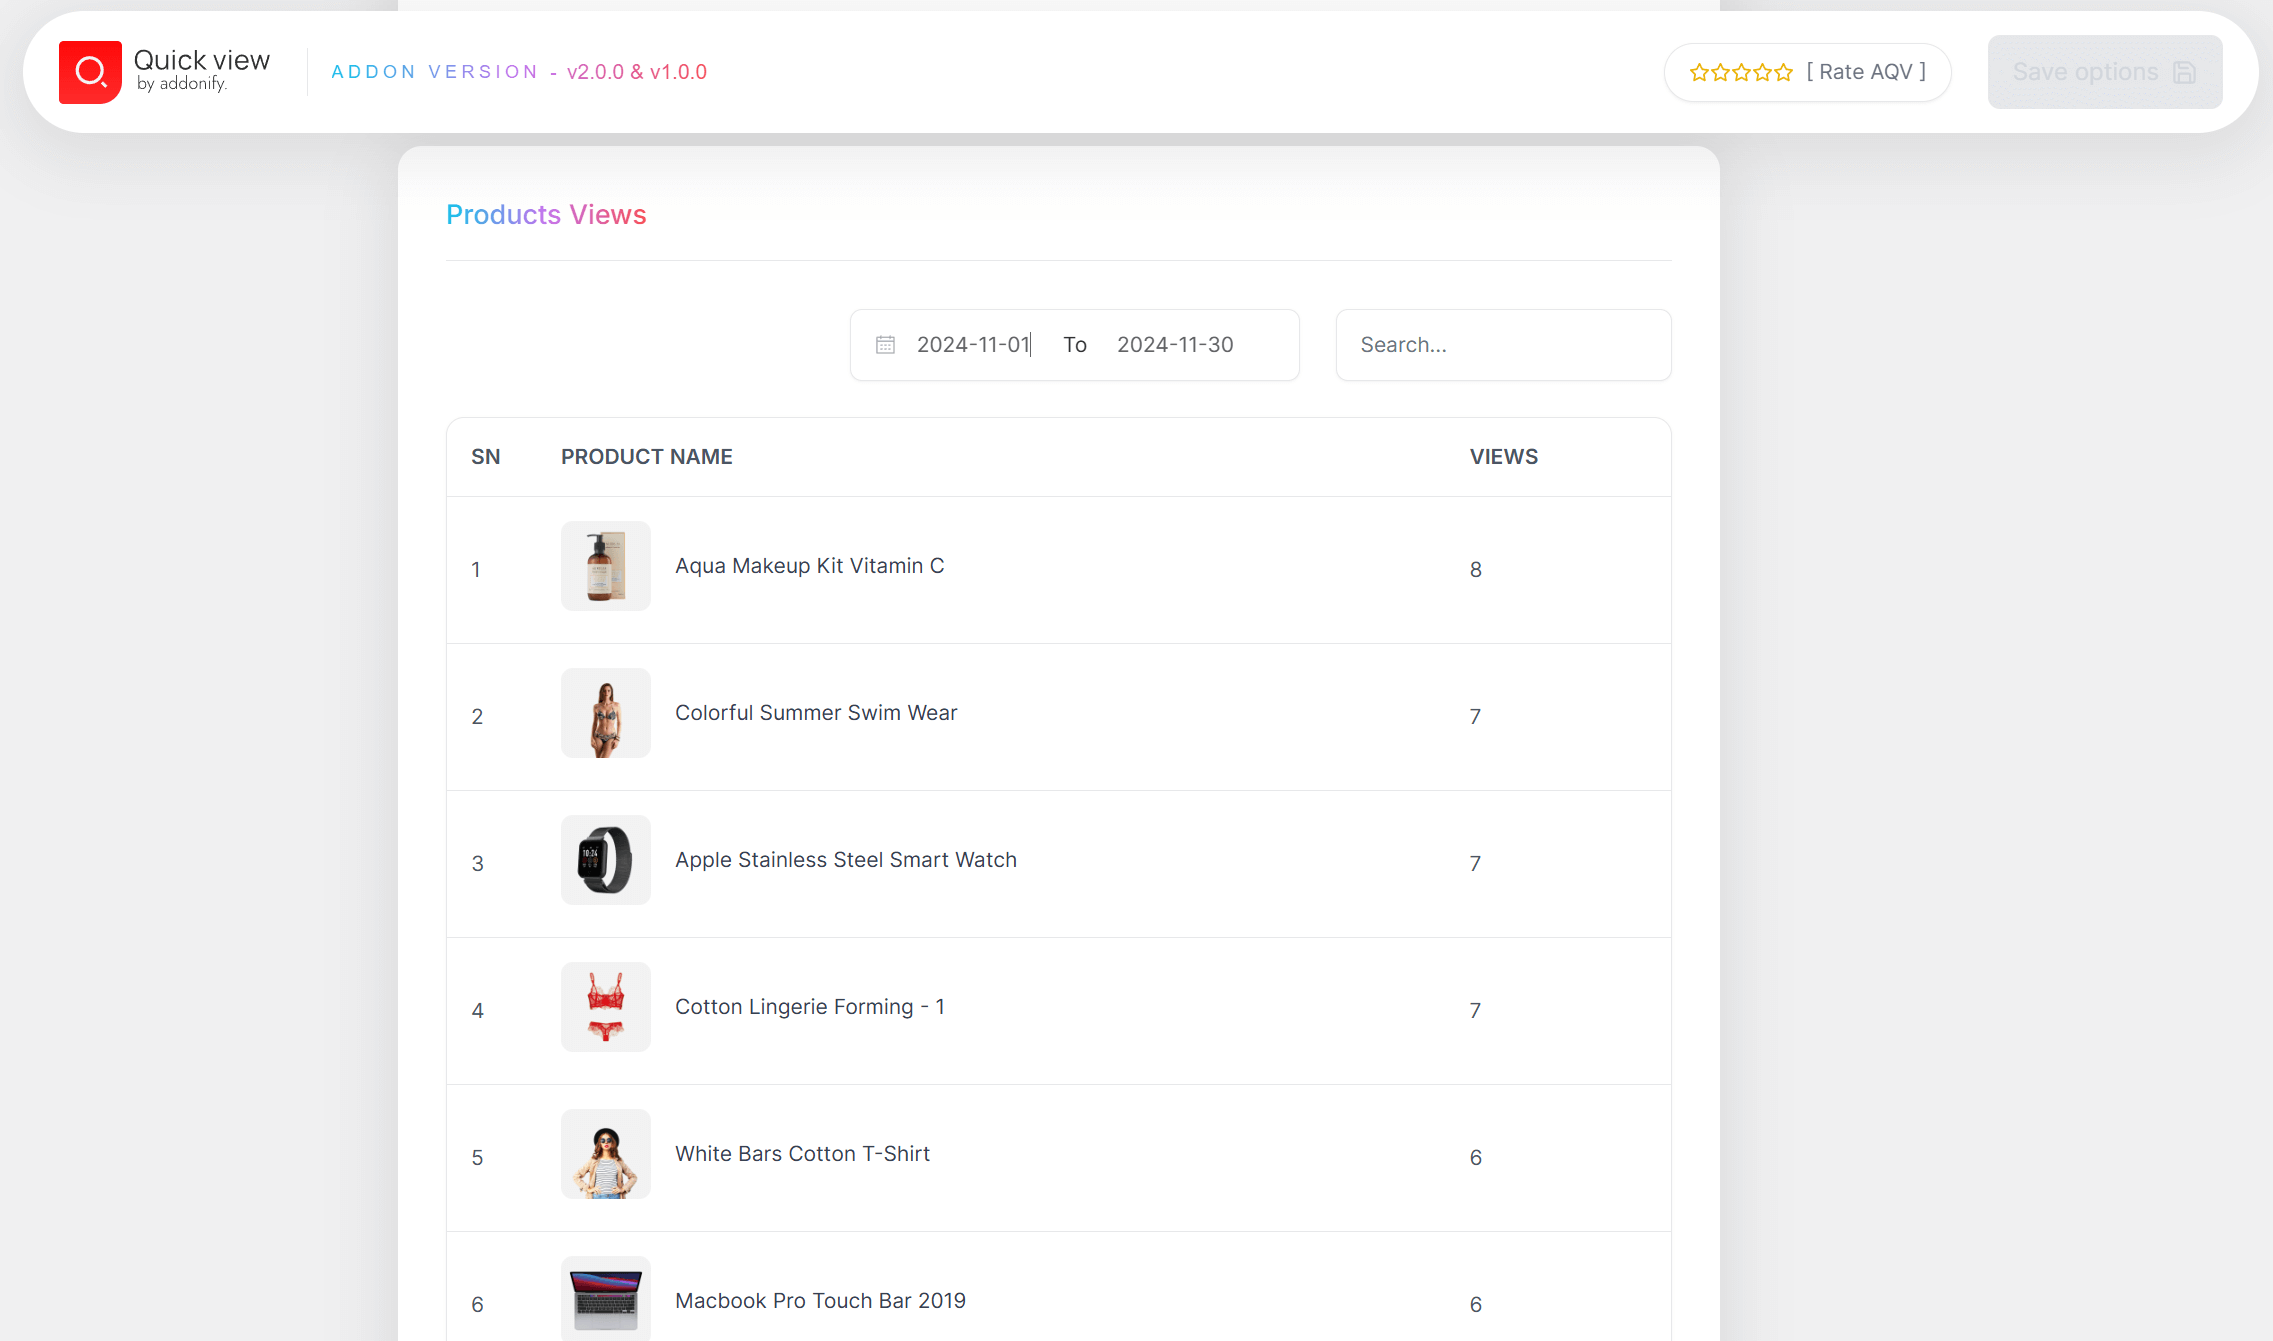
Products views count shows the total number of times a individual product was viewed in a single day or a specific date range. You can view data for different time intervals using the provided date filter. By default, the time interval is set to 15 days, allowing you to view data from the last 15 days. The product views count is updated in real-time.
These metric helps you to understand which product is most popular among the users. You can use this data to maintain the stock, adjust the price, offer deals or perform necessary actions to improve the sales. The product views count is represented in a tabular format for better understanding. The table shows the product name, product views count, and the date range.
Date filter for products views (pro)
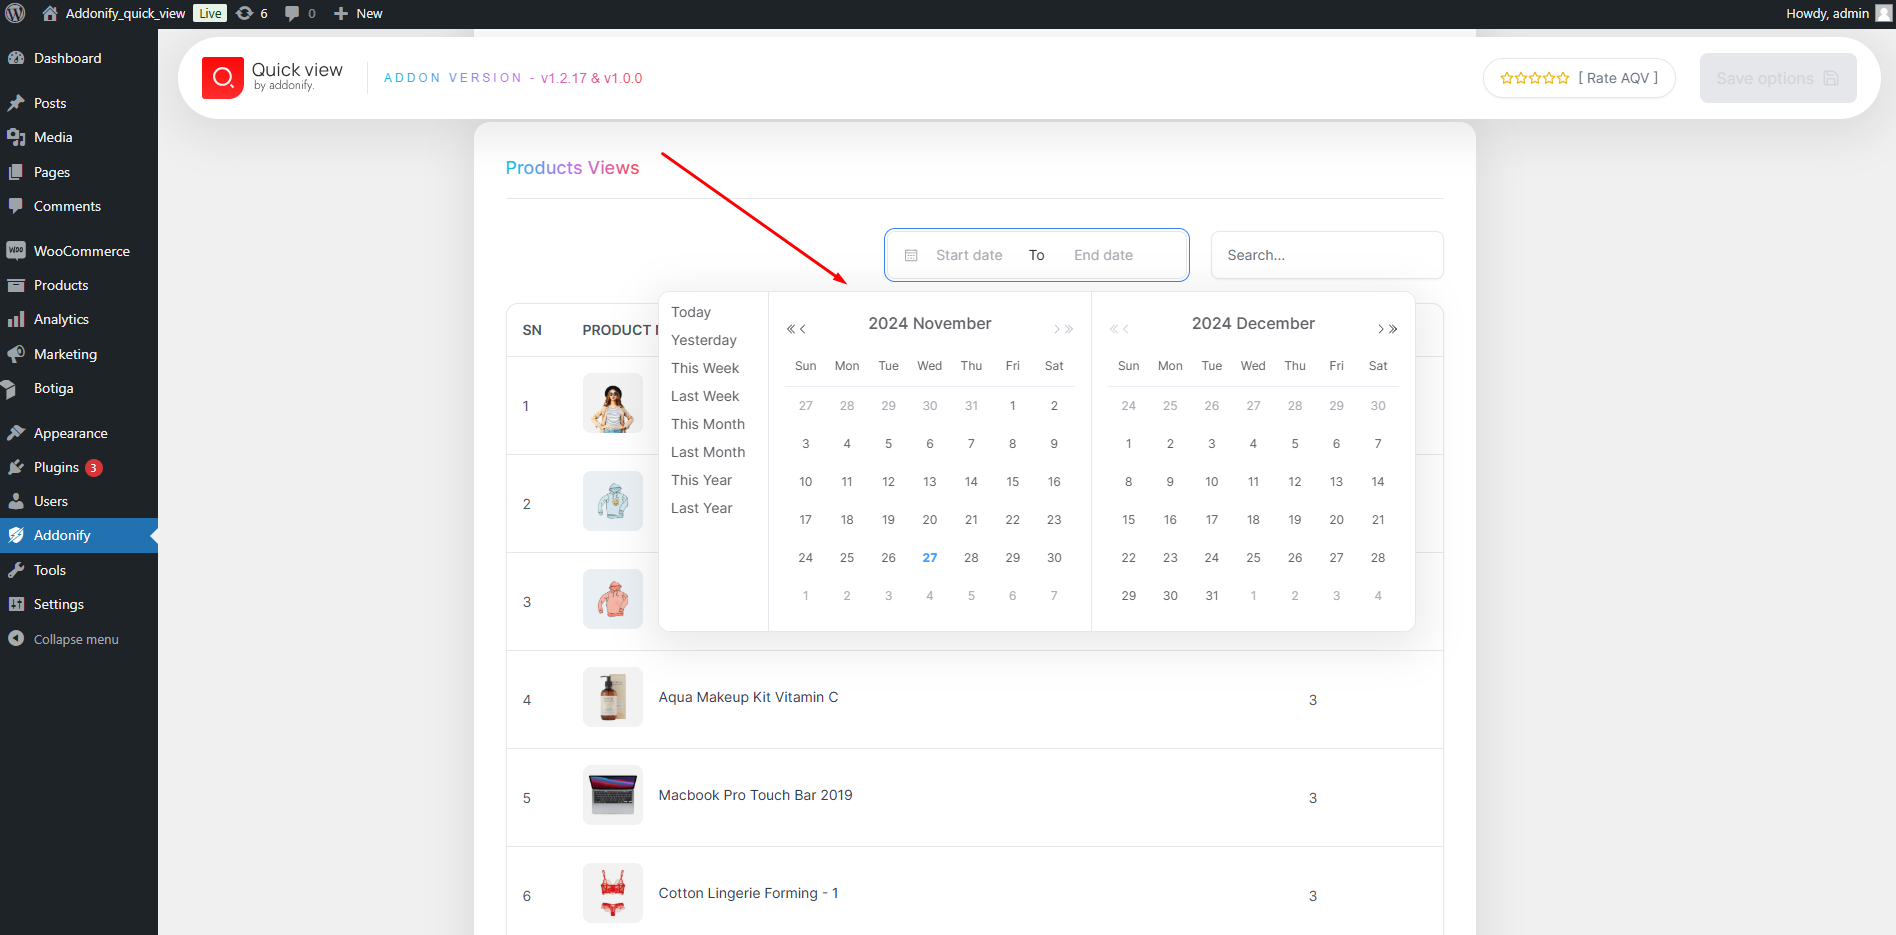
You can view product view data for different time intervals using the date filter provided. Simply click the start date and end date fields to select a range. You can also use predefined time intervals or create custom intervals by specifying the ‘Start’ and ‘End’ dates.
How the views are tracked?
When the user click on the quick view button or navigates to the product detail page, the view is tracked and stored in the database. The view count is updated in real-time. The view count is stored in the database and can be accessed from the analytics page. Lets assume we have products A, B, C & D. Even though the user views the product A multiple times, the view count is updated only once for that day. The view count is updated based on the user session. If the user views the product A multiple times in a single session, the view count is updated only once. If the user views the product A in a different session, the view count is updated again.
Hence, the view count is updated based on the user session and the click interaction.
Limitations
The technique used to track the views is based on the user session. The view count is updated only once for a single session. The view count is updated again if the user views the product in a different session or browser. This approach of tracking the views is to avoid the duplicate views and provide accurate data.
On the other hand some store owners might want to track the views each time the user views the product. This feature is not available in the current version. We plan to add this feature in the future updates. If you have any suggestions or feedback, feel free let us know.


